
Dr. Areef Suleman is Director of Economic Research and Statistics at the Islamic Development Bank (IsDB) Institute. The views expressed in this essay are those of the author and do not imply or reflect the views of the IsDB Institute or IsDB Group.
In today's ever-changing world, where climate change is reshaping economies and exposing vulnerabilities, making informed investment choices is more crucial than ever. A savvy investor’s quest for investment risk mitigation and sustainability requires a more prudent, data-driven, evidence-based approach that transcends national borders.
We are witnessing investment migration programs more widely across the globe. Hence, investors are faced with a range of options to choose where to live, conduct business, invest, and retire, with the benefits being not just for themselves but also for future generations. The decision about where to invest then needs to include considering economic resilience and returns in the face of climate-related and sustainability threats.
To shed some light on this decision, select climate-related and sustainability indicators of G7,[1] BRICS plus Six,[2] and countries with investment migration (IM) programs are compared in the new Henley Wealth and Sustainability Report. There are 17 IM countries in the data used in this essay,[3] four of which are G7 countries (Canada, Italy, the UK, and the USA), while one is a BRICS plus Six member country (the UAE).
Among the crucial indicators of a country’s environmental footprint and contribution to global climate change is its CO2 emissions (measured in metric tons) per capita. The data reveals that from the year 2000 to 2020, CO2 emissions per capita in the BRICS plus Six bloc have been increasing slightly. However, it’s worth noting that the rate of increase in the last decade has tapered off compared to the period from 2000 to 2010 (Figure 1). In contrast, the CO2 emissions per capita in IM countries have steadily declined from 2000 to 2020, closely mirroring the trend observed in the G7 countries. However, when excluding intersecting G7 economies from the pool of IM countries, the latter’s CO2 emissions per capita become even lower and have been exhibiting a declining trend since 2017.
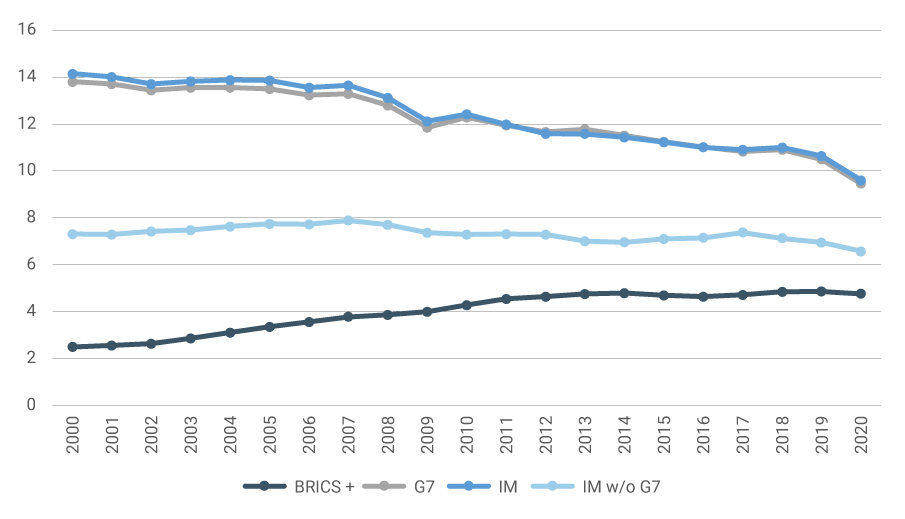
Figure 1. CO2 Emissions (Metric Tons) per Capita
Note: Author’s calculations. CO2 emission in metric tons is summed by grouping and is divided by the total population in the same grouping.
Source: World Bank. (2023). World Development Indicators. databank.worldbank.org/source/world-development-indicators# accessed on 21 October 2023
While CO2 emissions aren’t a direct measure of a country’s air pollution levels, many of the sources that emit CO2, such as fossil fuel combustion in vehicles, power plants, and industrial processes, also release other pollutants, including fine inhalable particles (PM2.5). Figure 2 shows that when it comes to levels of air pollution (measured by PM2.5 micrograms per cubic meter), IM countries have the lowest readings. Interestingly, the eight countries with the lowest PM2.5 presence are IM countries, with Australia and New Zealand having the cleanest air in the sample. Conversely, the eight countries with the highest levels of PM2.5 are the BRICS plus Six countries, with India leading the pack, recording over 83 micrograms of PM2.5 per cubic meter in 2019 (the most recent data available).
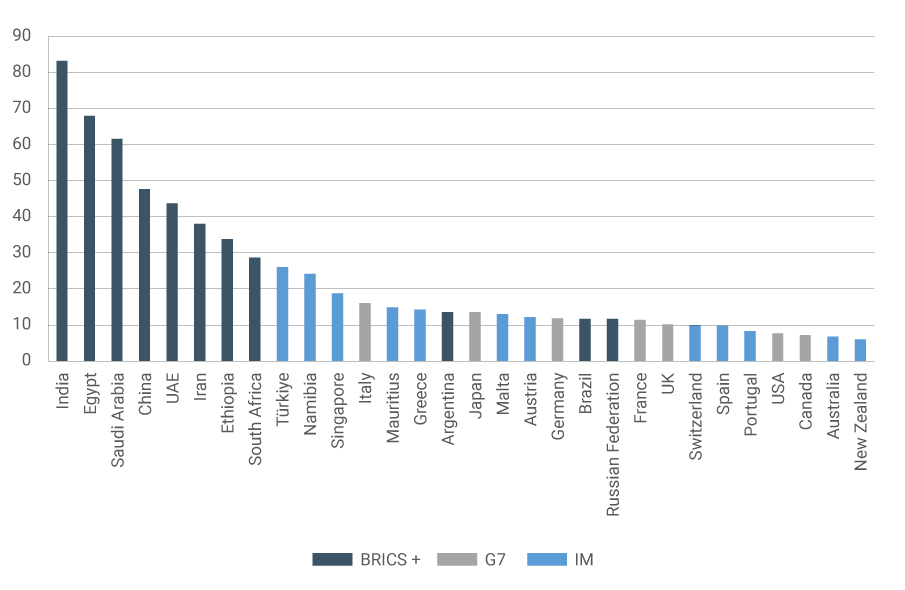
Figure 2. PM2.5 Micrograms per Cubic Meter in 2019
Note: PM2.5 is an indicator measuring the level of air pollution in a country by accounting for the presence of PM2.5 in micrograms per cubic meter. The 2019 data is the latest available data for this indicator. Canada, the UK, and the USA are G7 economies with investment migration programs.
Source: World Bank. (2023). World Development Indicators. databank.worldbank.org/source/world-development-indicators# accessed on 21 October 2023
In terms of 2022 population demographics, Figure 3A shows that a significant portion of the BRICS plus Six populations belong to the 0–14 age group. This implies that, with a sustained level of human capital development, the BRICS plus Six bloc can sustain the high share of its working age population. On the other hand, G7 economies have an ageing population, with 21% of their populations aged 65 and older. Meanwhile, IM countries have a relatively balanced young and old population and maintain a high share of their populations that are aged 15–64. Focusing on the average population growth rates of each group, IM countries (without the G7 countries) have the highest average population growth rate at 1.1%, followed by BRICS plus Six at 0.98%, IM countries at 0.81%, and G7 at 0.47%.
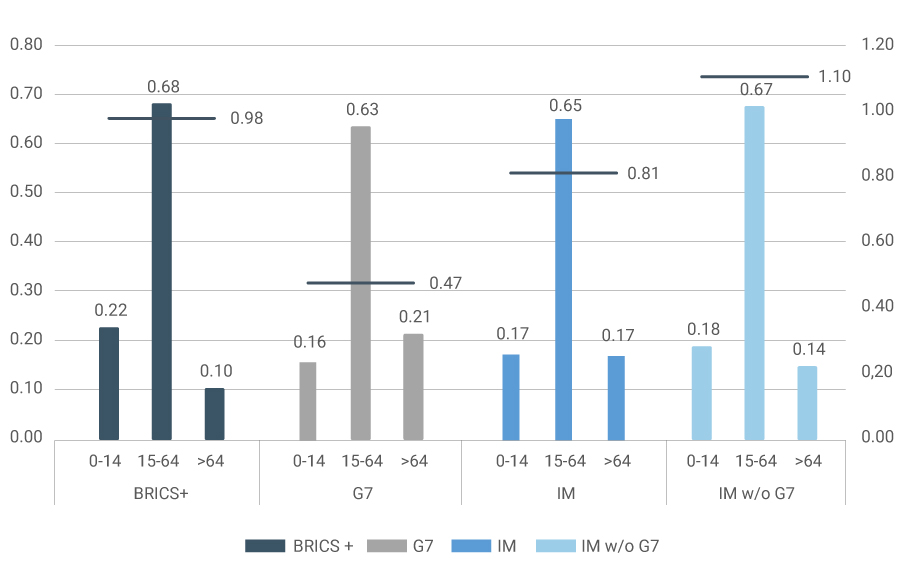
Figure 3A. Average (2001–2022) Population Growth Rate and 2022 Population Demographics
Note: Clustered columns represent the share of each age category in the group’s pooled 2022 population totals. Refer to the left-hand y-axis for this. The lines represent the average population growth rate of the group between 2001 and 2022. Refer to the right-hand axis for this.
Source: World Bank. (2023). World Development Indicators. databank.worldbank.org/source/world-development-indicators# accessed on 21 October 2023. Author’s calculations.
Another aspect to consider when assessing sustainability is a country’s population density (the number of people per km2). High population densities put a strain on natural resources and infrastructure. As evident from Figure 3B, IM countries have the lowest population density among the three groups. Population density in IM countries increased marginally from about 21 people per km2 in 2000 to about 25 people in 2021, similar to the rate of increase observed for the G7 group. In contrast, the BRICS plus Six group, which includes densely populated countries such as India and China, have experienced a more rapid rise from 63 people per km2 in 2000 to about 78 people in 2021.
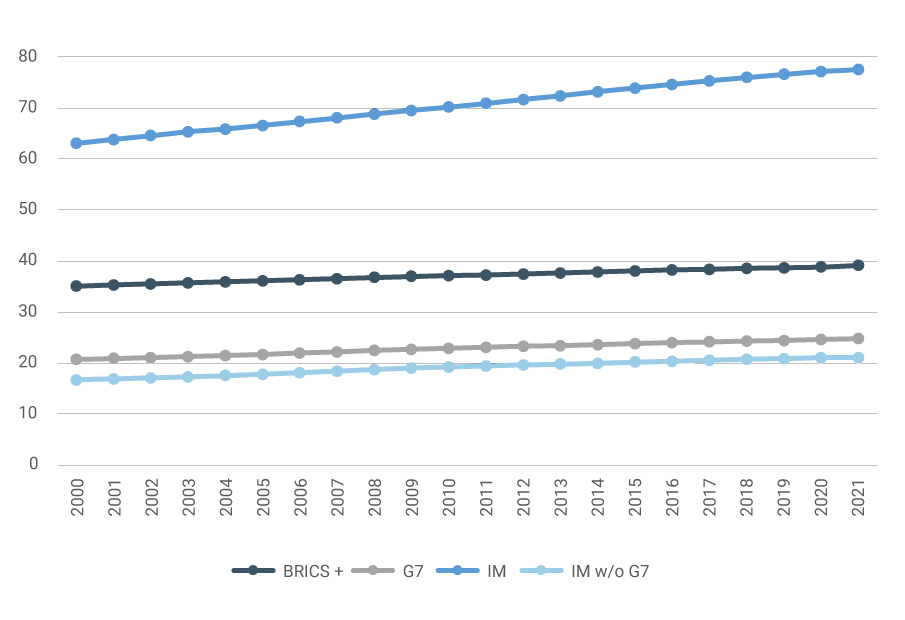
Figure 3B. Population Density (Number of People per km2 of Land Area)
Note: Author's calculations. CO2 emission in metric tons is summed by grouping and is divided by the total population in the same grouping.
Source: World Bank. (2023). World Development Indicators. databank.worldbank.org/source/world-development-indicators# accessed on 21 October 2023
To further contextualize how different countries fare on the sustainability scale, Figure 4 illustrates the median Logistics Performance Index (LPI), which assesses each group’s quality of trade and transport-related infrastructure. This indicator is important in understanding a country’s commitment to maintaining and improving its infrastructure, which is an important driver for sustained economic growth.
Although the BRICS plus Six countries’ population density increased steadily, its LPI has also increased since 2007, albeit at a slower rate. This dynamic suggests that despite the increasing population density among BRICS plus Six countries, the average quality of trade and transport-related infrastructure has not deteriorated. Interestingly, the most significant improvement was observed over the past four years, from 2018 to 2022. Similarly, IM countries have seen an increase in their LPI from 2007 to 2022, approaching the levels observed in G7 countries.
Shifting focus to the quality of human capital, which is a good indication of the level of productivity to spur economic growth, the Human Capital Index (HCI) measures the quality of a country’s population health and education outcomes. Figure 4B highlights a relatively wider gap between BRICS plus Six countries and G7 and IM countries. From 2010 to 2020, the median HCI of IM and G7 countries closely tracked each other, showing limited growth. The HCI of BRICS plus Six economies has seen a modest improvement in the same period. However, there is still significant ground to cover when it comes to improving the bloc’s population health and education outcomes.
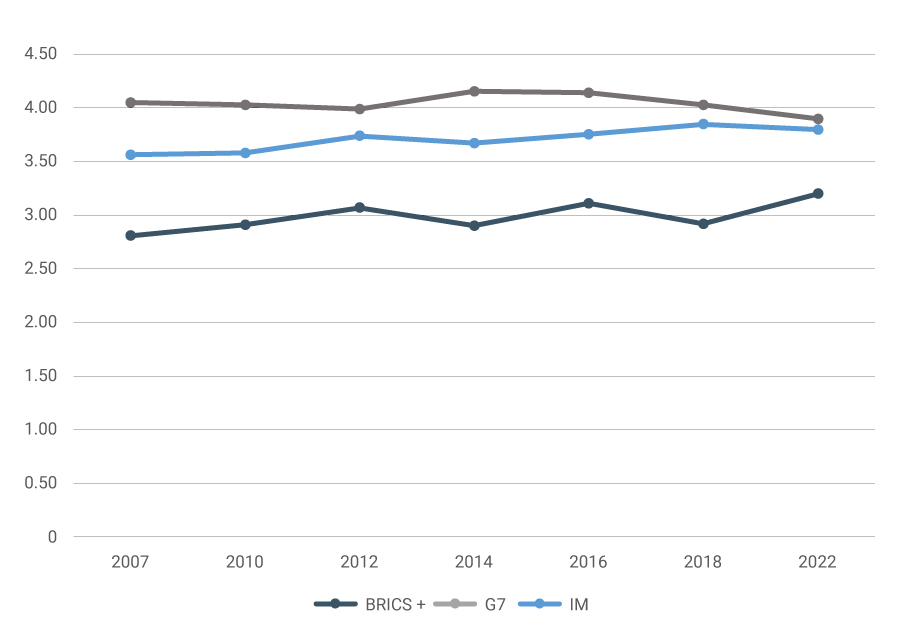
Figure 4A. Median Logistics Performance Index: Quality of Trade and Transport-Related Infrastructure (1 = low, 5 = high)
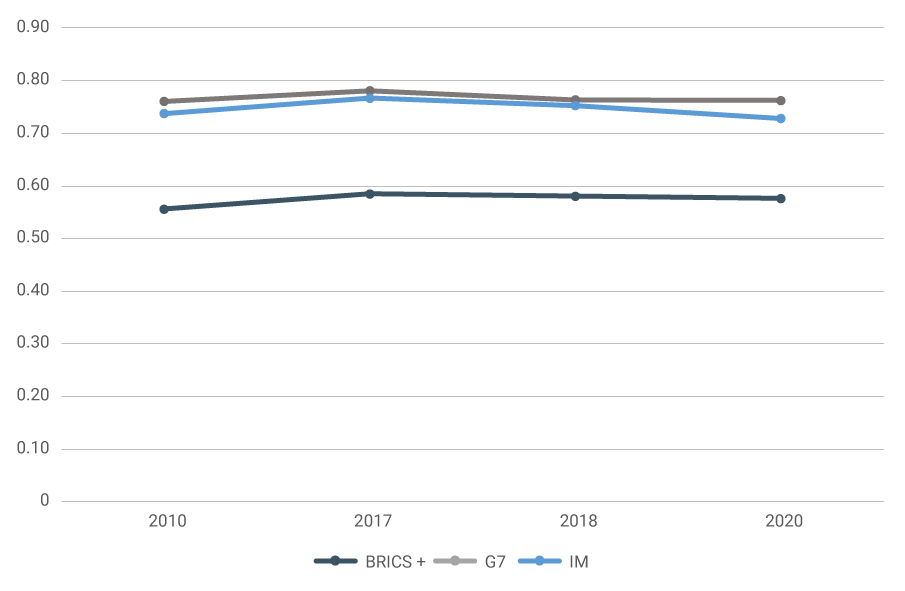
Figure 4B. Median Human Capital Index: Quality of Trade and Transport-Related Infrastructure (scale 0–1)
Note: Author’s calculations. Data for years for which data is available is shown in each graph.
Source: World Bank. (2023). World Development Indicators. databank.worldbank.org/source/world-development-indicators# accessed on 21 October 2023
The GDP per capita of IM countries closely mirrors the GDP per capita level and trend observed in G7 countries from 2000 to 2022. Interestingly, the gap between the two values significantly narrowed in the past two years. This convergence is primarily driven by the high GDP per capita growth rates in 2021 and 2022 of the UAE, which is among the IM countries. The GDP per capita of IM countries has shown an impressive increase, more than doubling from around USD 27,000 in 2000 to USD 55,000 in 2022. However, removing G7 countries from the pool of IM countries reveals that the GDP per capita gap between the two group has widened between the 2008 global financial crisis and the 2020 Covid-19 pandemic. It was only in the past two years that the gap showed a marginally narrowing trend.
In comparison, the GDP per capita of BRICS plus Six countries is significantly lower than the other two groups. Given the low base, it is not surprising that the rate of increase of the former’s GDP per capita far exceeds the growth rates of the latter, growing from about USD 1,200 in 2000 to about USD 8,000 in 2022. This change is to some extent driven by China’s GDP per capita growth in the same period, which more than tripled from about USD 14,000 in 2000 to USD 48,000 in 2022. There is potential for BRICS plus Six economies to continue along this rapid growth trajectory, with the projected continued growth of China and other BRICS plus Six economies. Figure 5B shows that the average GDP growth rate of BRICS plus Six economies since 2001 has been the highest among all four groups in the data, at 10.5%. The average GDP growth rates of G7, IM, and IM (without G7) countries from 2001 to 2022 are 3.2%, 4.3%, and 5.6%, respectively.
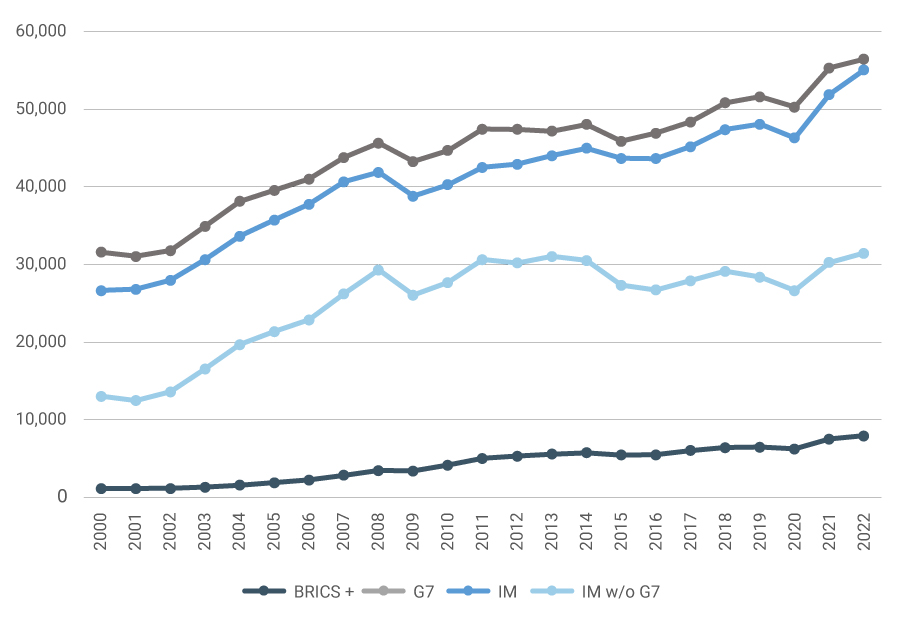 Figure 5A. GDP per Capita (Current USD)
Note: Author’s calculations.
Source: World Bank. (2023). World Development Indicators. databank.worldbank.org/source/world-development-indicators# accessed on 21 October 2023
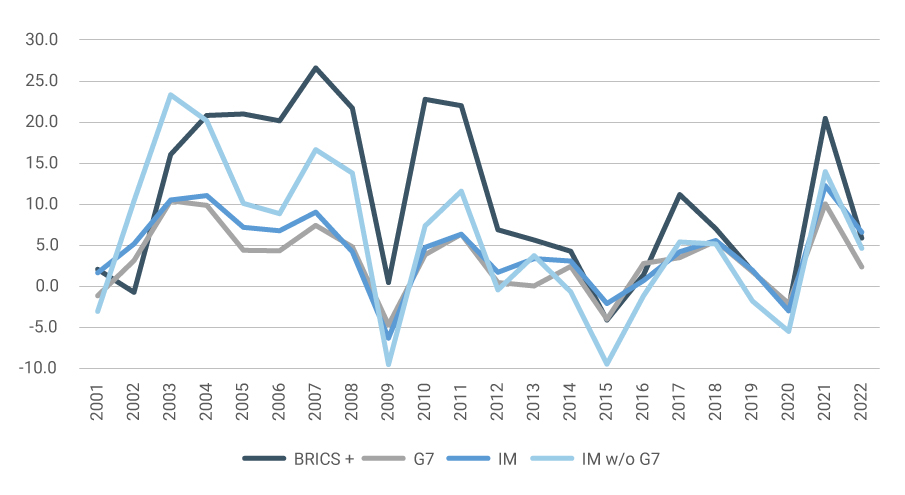
Figure 5B. GDP Growth Rate (Current USD)
Note: Author’s calculations.
Source: World Bank. (2023). World Development Indicators. databank.worldbank.org/source/world-development-indicators# accessed on 21 October 2023
A more complete view of an economy’s financial health goes beyond GDP flow and also takes into account the level of wealth accumulation over time. The Henley Wealth and Sustainability Report data supplements GDP figures by also considering several additional factors. These include, among others, the efficiency of the banking sector and the stock market impact of property and stock movements on private wealth creation. Not surprisingly, Figure 6 illustrates that countries with high GDP per capita tend to have high wealth per capita. Switzerland has the highest wealth per capita in the sample at USD 352,000, followed by Singapore at USD 203,000, and the USA at USD 198,000. Notably, these are all IM countries. In fact, the top nine countries in the sample with the highest wealth per capita all have investment migration programs.
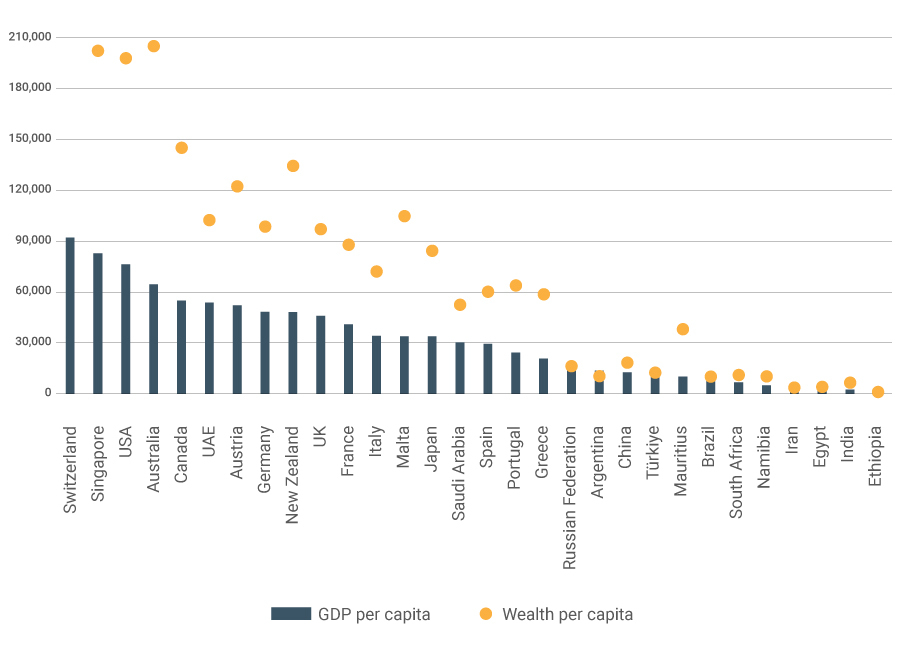
Figure 6. GDP per Capita (Current USD, 2022) and Wealth per Capita (Current USD, as of June 2023)
Note: Switzerland’s wealth per capita (USD 352,000) is omitted from the chart for better illustration.
Sources: GDP per capita: World Bank. (2023). World Development Indicators. databank.worldbank.org/source/world-development-indicators# accessed on 21 October 2023
Wealth per capita: Henley & Partners. (2023). Henley Wealth and Sustainability Report accessed on 21 October 2023
This analysis provides a data-driven perspective on how residence and citizenship by investment programs can be leveraged to enhance investment resilience and sustainability. IM countries consistently performed better than G7 and BRICS plus Six countries in key areas such as environmental responsibility, infrastructure reliability, healthcare and education quality, economic growth, and wealth accumulation. These insights underscore the wisdom that investment migration offers high-net-worth individuals in securing a sustainable future for themselves and their progeny. In an ever-changing world, data and evidence-based decision-making provide the right compass for investors and families seeking a path to economic prosperity and sustainability.
Notes:
[1] The G7 countries comprise Canada, France, Germany, Italy, Japan, the UK, and the USA.
[2] BRICS plus Six countries comprise Brazil, Russia, India, China, South Africa, Argentina, Egypt, Ethiopia, Iran, Saudi Arabia, and the UAE.
[3] The remaining 12 IM countries are Australia, Austria, Greece, Malta, Mauritius, Namibia, New Zealand, Portugal, Singapore, Spain, Switzerland, and Türkiye.
As the global leader in residence and citizenship planning, Henley & Partners is best placed to advise you and your family. Contact us for a free consultation.