
Dr. José Caballero is Senior Economist at the IMD World Competitiveness Center in Lausanne, Switzerland.
As the global economy enters a period of heightened geopolitical instability, and the impact of climate change is ever more apparent, a detailed assessment of wealth generation, economic growth in general, and environmental trends is essential for our understanding of the potential disruptions to countries that host investment migration programs. In this context, a focus on the resilience of such countries is crucial. To this end, on the one hand, the Henley Wealth and Sustainability Report (WSR) assesses the extent to which countries manage wealth/economic growth, the safeguarding of the natural environment, and the well-being of their populations. On the other hand, the Hinrich–IMD Sustainable Trade Index (STI)[1] measures the effectiveness of the participation of countries in the global trading system in a manner that supports the long-term goals of economic growth, environmental protection, and societal development. An analysis of the intersection of the two studies reveals the resilience of countries offering investment migration options, but going forward, a balanced strategic approach is essential for sustainability.

The WSR studies 31 countries and the STI studies 30 but there are only 10 countries in common between the two indexes (see Table 1). This essay focuses on those countries and traces their performance in the STI at three levels of analysis: overall ranking, its pillar components, and a set of selected indicators. To facilitate our assessment of the resilience of investment migration hosts, we categorize countries as investment migration (IMs) and non-investment migration (non-IMs). The IMs are Australia, Canada, New Zealand, Singapore, the United Kingdom, and the United States, and the non-IMs are China, India, Japan, and Russian Federation.
Table 1. STI Overall and Pillar Rankings
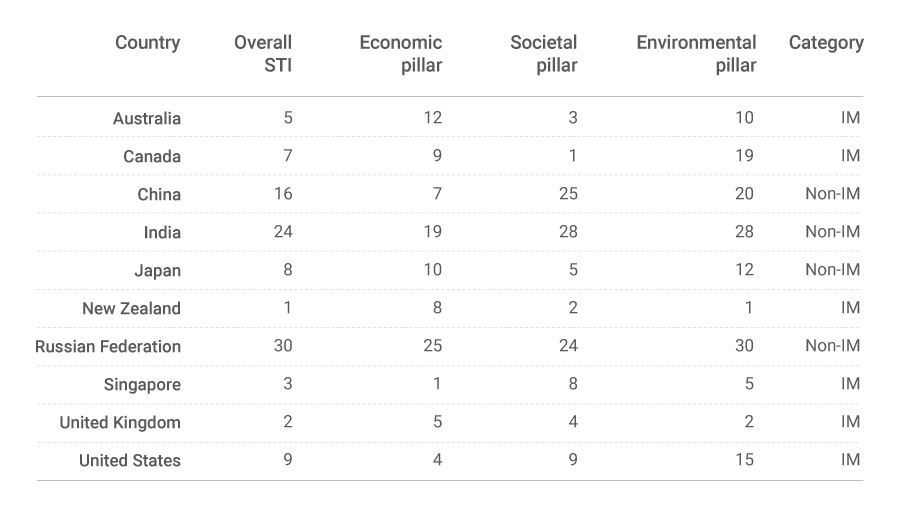
In terms of the overall STI ranking,[2] IMs lead the way with New Zealand ranking 1st, the United Kingdom 2nd, and Singapore 3rd. Among non-IMs, Japan (8th) ranks highest, China is in 16th place, and India in 24th, with the Russian Federation (30th) ranking lowest among the countries considered in this essay.
The STI’s economic pillar captures the investment conditions, the ease of conducting business, and trade barriers (among other factors) as facilitators of economic growth. IMs lead the rankings in this pillar as well, with Singapore (1st) at the top. Non-IMs are led by China (7th) with the Russian Federation (25th) again placing at the bottom of the sample considered.
Results are similar in the societal pillar, which captures the social factors that contribute to an economy’s development of human capital that supports international trade, such as education levels and labor standards. Among the indicators employed to assess it are inequality, political stability, and exploitative practices such as child labor. IMs capture the top four positions in this pillar with Canada (1st) ranking highest. While Japan (5th) reaches the highest rank among non-IMs, India (28th) ranks lowest.
The environmental pillar measures the extent to which an economy uses natural resources and manages the negative externalities from its economic growth and participation in the global trading system. The pillar considers, for example, air and water pollution and the share of natural resources in exports. New Zealand (1st) tops the ranking in this pillar. There are, however, some signs of concern among IMs. While Canada reaches only the 19th position, the United Stares places at 15th and Australia at 10th. In the non-IM category, Japan (12th) ranks highest in this pillar; the Russian Federation (30th) places at the bottom.
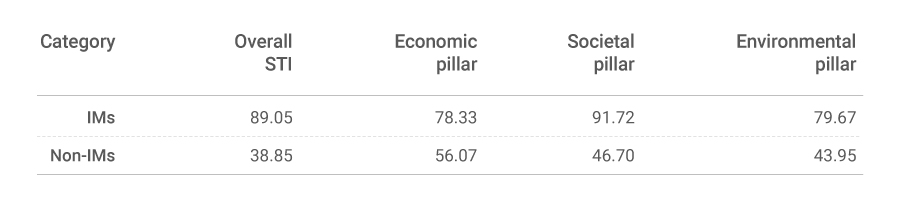
Table 2 presents the average scores of the overall STI and its pillars per country-category. It shows that IMs are comfortably well positioned in the higher levels of STI analysis. In the overall and societal pillars, on average IMs achieve about double the scores of non-IMs. In the economic and environmental pillars, IMs’ advantage over their counterparts is lesser but remains significant, particularly in environmental matters.
Table 2. STI Overall and Pillar Average Scores, Averages by Category
At the indicator level, the trend is similar to the pillar results. Table 3 introduces a selected set of indicators (that is, two indicators per pillar). Within the economic pillar, the investment freedom indicator evaluates the regulatory restrictions imposed on investment. Results show that IMs offered the greatest investment freedom in our sample. The United States and Singapore (both 1st) both reach the top position in this indicator, and Japan (13th) ranks the highest among non-IMs.
Table 3. STI Selected Indicators Rankings
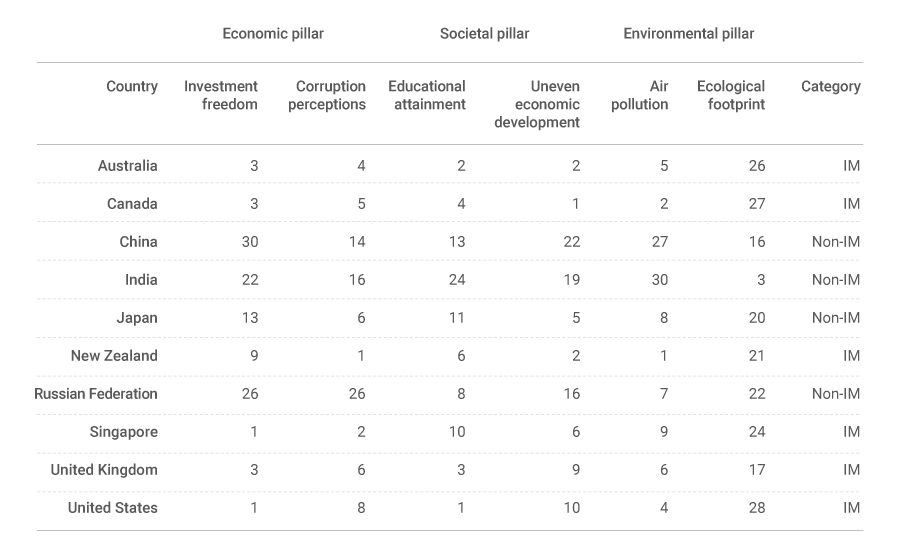
Corruption is detrimental to wealth generation and overall economic growth because, for example, it distorts the allocation of public resources and leads to inefficiencies in the public sector. It also undermines accountability, ultimately weakening governance and the rule of law. Thus, the next indicator we considered captures perceptions about corruption. New Zealand (1st) tops the ranking in this regard, and the Russian Federation (26th) places at the bottom of the sample considered. Among IMs, the United States (8th) ranks relatively low, perhaps reflecting the impact of its polarized and divided political landscape.
Within the societal pillar, the educational attainment indicator measures educational achievements and the quality of education. The United States (1st) is at the top of the ranking. Among IMs, Singapore (10th) ranks relatively low. The Russian Federation (8th) reaches the highest position among non-IMs.
Social inequalities (for example, economic and educational) negatively affect the creation of wealth and economic growth by, for instance, delimiting the development of human capital and social mobility. In unequal societies, there are disparities in access to quality education, healthcare, and other public goods and services. For this reason, the STI includes “the Uneven Economic Development” indicator, which considers inequality within the economy as well as opportunities for groups to improve their status. Canada (1st), Australia and New Zealand (both 2nd) top this indicator’s ranking. While the United States (10th) ranks comparatively low, Japan (5th) leads non-IMs, with China (22nd) in the bottom position of the sample considered.
One of the selected indicators from the environmental pillar captures the air pollution in the countries we study. New Zealand (1st) leads in this indicator, followed by Canada (2nd). The Russian Federation (7th) is the highest-ranking non-IMs, with China (27th) and India (30th) at the bottom of the table. Another indicator from this pillar is ecological footprint, which measures the ecological assets that a population or product requires to produce the natural resources it consumes (for example, plant-based food and fiber products, and space for urban infrastructure) and to absorb its waste. India (3rd) and China (16th) lead the way in ecological footprint. The United Kingdom (17th) is the highest-positioned IMs. At the bottom of the ranking are Australia (26th), Canada (27th), and the United States (28th).
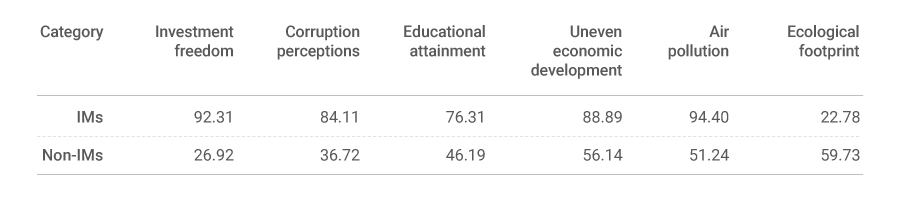
Table 4 presents the average scores of the selected set of indicators per country-category. The score differences are significant, which indicates that IMs outperform non-IMs in most of the indicators. This is particularly so in investment freedom in which the IMs’ score-value is over three times the value of non-IMs. Likewise, in corruption perceptions the score-value of IMs is over twice the value of non-IMs. In uneven economic development, the score difference is lesser which underlines the relative underperformance of some IMs in this regard. This trend is reversed in the ecological footprint indicator. Non-IMs outperform IMs with a score value that is over twice as great.
Table 4. STI Selected Indicators Scores, Averages by Category
Results thus indicate that there is a significant degree of resilience among IMs. The data shows that these countries have been able to steer off the different global events of the last few years including the Covid-19 pandemic and the Russia–Ukraine war, and their repercussions. To put it differently, results underline the fact that IMs remain highly attractive for investment migration because of the sustainability of their economies, societies, and environments.
It is, however, of paramount importance that such sustainability is guided by a strategy that approaches the different challenges in a balanced manner. What is needed is a strategy that does not prioritize one issue at the cost of another. For example, in Canada’s case, a more balanced approached is necessary in terms of tackling inequality and ecological footprint issues. Canada ranks the highest in the former while placing second from the bottom in the latter. Similarly, the United States reaches the top position in economic freedom and educational attainment but ranks relatively low in social inequality and at the bottom in ecological footprint.
Notes
[1] For more details of index structure, methodology, and definitional matters, see the Hinrich–IMD Sustainable Trade Index 2023 available from imd.org/centers/wcc/world-competitiveness-center/rankings/sustainable-trade-index/
[2] Please note that all references to ranking positions is out of a total of 30 countries.
As the global leader in residence and citizenship planning, Henley & Partners is best placed to advise you and your family. Contact us for a free consultation.