
Dr. José Caballero is the Senior Economist at the IMD World Competitiveness Center.
As we look towards the future of the world’s Top 50 Cities for Millionaires in 2025, it is notable that among the fastest growing wealth hubs over the past decade, Asian and Middle Eastern cities are leading the way in smartness. Such innovative focus can only strengthen their attractiveness for high-income individuals looking to relocate to and benefit from living in a technology-driven metropolis.
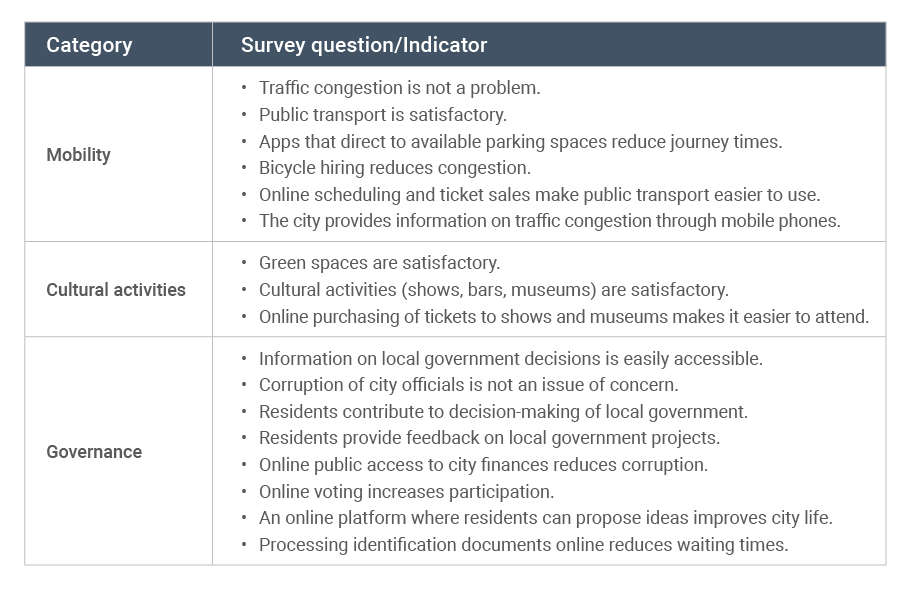
A smart city, simply put, is a system that aims at improving the quality of life of its citizens using technologies, with different aspects of smartness contributing to such an enhancement. Among the fundamental elements of a city’s smartness are mobility or the efficiency of the transportation system, the availability of cultural activities, and the effectiveness of governance. In this essay, using data from the IMD Smart Cities Index (SCI) we build three measures (categories) to assess the performance in these three elements of smartness of the World’s Fastest Growing Wealth Hubs identified in the World’s Wealthiest Cities Report 2025.1 Each measure consists of multiple indicators (see Table 1.)

The first category is an aggregated measure of mobility, which captures how technology has advanced the effectiveness of public transport and reduced problems related to traffic congestion by contributing to its planning and management. The second factor assesses the impact of the cultural activities that a city offers, which are important because they foster social capital (for example, by increasing social interactions) and enhance the development of skills in the younger population. The third measure evaluates the governance of the cities, which reflects the effectiveness of the rule of law. Governance is essential to minimizing personal risks, reducing uncertainty when dealing with public officials, and increasing the transparency of the political system and the participation of citizens in civil processes. Ultimately, governance sets the foundation of the quality of life that a city offers.
Table 1. Smartness Categories and Indicators
To construct the smartness measures, we aggregate the yearly scores and produce the simple average of all its indicators. The data for these indicators captures the perceptions of the general population (expressed in percentages) about the performance of their city of residence in several aspects of smartness. Although the SCI’s survey has been conducted yearly since 2019, we have constructed the three smartness measures for the period between 2021–2025 as the SCI’s sample includes fewer cities in 2019 and 2020. It is also important to note that the SCI was not published in 2022.2
During the period covered, Shenzhen (China) dominates the mobility measure (see Table 2a). This despite a 3.89% drop in its score from 76.98% (2021) of respondents approving the city’s efforts in improving mobility through technology, to 73.09% in 2025. Shanghai (China) and Abu Dhabi (UAE) follow with 71.45% and 70.98% of respondents, respectively, highlighting the positive impact of their cities’ mobility efforts.
Table 2a. Smartness of High-Growth Cities: Mobility, 2021–2025

Other cities that score highly in mobility are Delhi and Mumbai (both in India) with 64.16% and 63.39%, respectively — both showing strong improvement from 2021. In addition, San José (Bay Area, USA) and Bangkok (Thailand) show the largest rise in their scores between 2021 and 2025 — 3.50% and 2.89%, respectively.
Despite its score increasing over the years, San José remains among the lowest scoring cities in the mobility measure together with San Francisco (also a Bay Area, USA city), with both scoring below 50%, although in 2025, the latter’s score is much higher than the former’s. Other cities with lower scores are Washington DC (USA) and Vancouver (Canada), with scores of 46.69% and 43.98%, respectively.
Dubai (UAE) leads in cultural activities in 2025, with 86.09% of its citizens perceiving that the city contributes valuable cultural activities and uses technology to enhance these services (see Table 2b). Dubai’s rise by 3.84% since 2021 to the top in cultural activities has seen it surpass another UAE city, Abu Dhabi (85.03% in 2025). Two Chinese cities follow Dubai: Shenzhen achieves 86.05% in 2025 (84.40% in 2021 and 86.41% in 2024) and Shanghai scores 85.05% (83.94% in 2021 and 85.32% in 2024).
Table 2b. Smartness of High-Growth Cities: Cultural Activities, 2021–2025
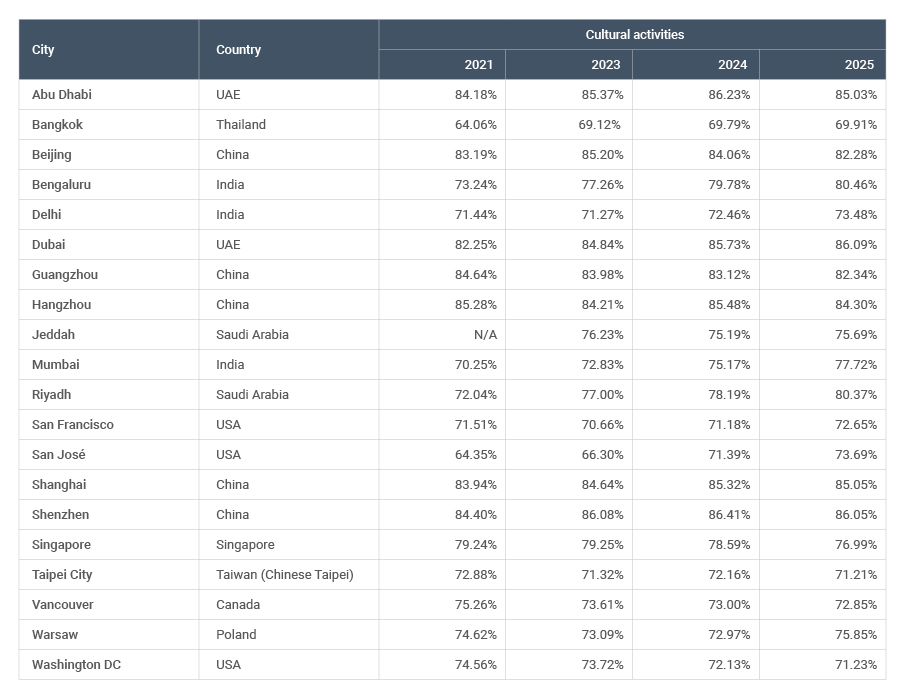
The cities with the biggest increases in cultural activities scores are San José, which improved by 9.34% from 2021 to 2025, followed by Riyadh (Saudi Arabia) improving by 8.33% and Mumbai by 7.47%.
In 2025, Taipei City (Taiwan, Chinese Taipei) and Bangkok are the lowest scoring cities in cultural activities, with 71.21% and 69.91%, respectively. In the case of Taipei City, this represents a drop of 1.68% and for Bangkok a gain of a 5.86% since 2021.
Two UAE cities lead in the governance measure in 2025: Dubai achieves 73.77% and Abu Dhabi 73.63% (see Table 2c). Both wealth hubs have increased their scores since 2021, by 3.65% and 2.34%, respectively, overtaking three Chinese cities, Guangzhou, Shenzhen (which saw the biggest drop overall), and Beijing, which have all experienced a decline in their scores of 1.76%, 4.44%, and 3.55%, respectively.
Table 2c. Smartness of High-Growth Cities: Governance, 2021–2025

Another Chinese city, Hangzhou, has seen a significant drop in its governance score, from 73.22% in 2021 to 68.94% in 2025, a difference of 4.28%. Jeddah (Saudi Arabia) has also experienced a notable decline of 2.67% from 2023 to 2025.3
Bangkok, San José, and Warsaw (Poland) display the largest improvements in the governance measure, with their scores rising by 9.11%, 8.97%, and 6.45%, respectively, since 2021. Bengaluru (India) has also performed well, with an increase of 6% between 2021 and 2025.
As with its mobility score, San José’s rising governance score has not elevated it from being the lowest scoring city in this measure in 2025, with a score of 38.15%. Other cities that score relatively low in governance are the other Bay Area city, San Francisco, Vancouver, and Washington DC, with scores of 49.72%, 50.03%, and 50.85%, respectively.
Among the wealth hubs we assess, Asian and Middle Eastern cities fare far better overall than those in North America in the three smartness measures we have constructed. In 2025, Shenzhen is among the top cities in each of the smartness measures, as are Dubai and Abu Dhabi, while San Francisco, Vancouver, and Washington DC are among the lower scoring cities.
Among the cities that have improved across the trio of smartness measures between 2021 and 2025 are Bangkok, Bengaluru, and Mumbai, while Hangzhou, Vancouver, and Washington DC have declined. Although, Hangzhou remains among the top performers despite its decline, while Vancouver and Washington DC continue to be on the opposite end of the smartness spectrum.
Notes
1 The World’s Wealthiest Cities Report 2025 identifies 27 high-growth cities, that is, cities with over 10,000 millionaire residents and growth of over 50% during the 2014–2024 period. Of these 27 cities, we are able to assess 20, with an especial case in reference to ‘the Bay Area’ in the USA included in the World’s Wealthiest Cities Report, which includes San Francisco and Silicon Valley. The SCI’s survey covers San Francisco and San José. Therefore, in this essay we include the latter two cities separately.
2 For the conceptualization and methodological details of the SCI and individual city performances in the index, see imd.org/smart-city-observatory/home/methodology/
3 Data for Jeddah is not available for 2021.
As the global leader in residence and citizenship planning, Henley & Partners is best placed to advise you and your family. Contact us for a free consultation.