Released alongside The Henley Education Report 2026, this proprietary benchmarking tool measures how effectively premium education, combined with strategic residence or citizenship rights, translates into lifelong opportunity. It equips globally mobile families to identify the environments where access, networks, and institutional quality align to maximize career progression, earning potential, and economic mobility over time. Read the methodology and the press release.
The Henley Opportunity Index 2026 demonstrates how securing residence or citizenship rights in leading global economies can significantly amplify the long-term value of a top-tier education and enhance career prospects. While a world-class degree remains a powerful asset, its ultimate return depends on where graduates have the right to live and work. The index ranks the most effective residence and citizenship pathways — by investment and merit — that provide access to countries offering not only exceptional education systems, but also strong economies, dynamic career markets, and high levels of global mobility.
Research indicates that over 50-60% of global income variation is attributable to differences in national average income levels. Gaining access to higher-performing economies through education, combined with residence and/or citizenship rights, can therefore materially enhance lifetime earnings and overall quality of life.
Henley & Partners onboarded clients from 100 different nationalities and received enquiries from individuals in 217 territories in 2025 alone, underscoring the growing global demand for access to opportunity. Against this backdrop, The Henley Opportunity Index serves as a strategic resource for internationally mobile families seeking to expand the opportunity set available to their children and future generations.
The index evaluates 15 leading countries offering residence and citizenship programs across six key parameters:
Earning Potential
Career Advancement
Top-Tier Employment Prospects
Premium Education
Economic Mobility
High Livability
The ability to combine wealth generation with access to opportunity is a defining feature of the world’s most successful economies. By benchmarking these dimensions, the Henley Opportunity Index enables families to make more informed residence and citizenship planning decisions — aligning education pathways with access to high-value labor markets and long-term life prospects.
In doing so, the index provides a structured framework for future-proofing the next generation, empowering them to preserve and grow multigenerational wealth in an increasingly unpredictable world.
The framework includes parameters specifically relevant to internationally mobile families exploring residence and citizenship programs in high-performing countries with strong education systems. These pathways enable them and their children to access broader opportunities, including the ability to live, study, and work without the constraints of visas or work permits.
The six core parameters are earning potential, career advancement, top-tier employment prospects, premium education, economic mobility, and high livability. Each is converted into a score out of 100 and equally weighted to produce a total opportunity score out of 100.
Earning Potential
Participating in residence and citizenship programs is a long-term decision that enables individuals to live and work in the destination country over an extended period. Therefore, rather than focusing on entry-level salaries or macroeconomic indicators such as GDP, the earning potential score reflects projected annual earnings over a 10-year horizon, based on wage growth and adjusted for inflation.
The scores provide a high-level view of the job market by reflecting average salaries in US dollars for highly skilled professionals in senior roles across a range of sectors, including agriculture, the arts, business administration, finance, engineering, health, IT, law, and science. Given the diversity of career paths, the measure is designed to provide broad, comparable guidance.
Key data sources include: Country national statistics offices, International Monetary Fund, OECD, global salary benchmarking platforms (including but not limited to Glassdoor, Paylab, and Salary Expert )
Career Advancement
The career advancement score reflects the extent to which a country supports professional development and progression into higher-skilled roles. The parameter considers the presence of leading global corporations, based on the Fortune Global 500 ranking, as well as the availability of senior-level roles within globally recognized companies and international organizations.
The score also incorporates the percentage of the labor force with advanced education, reflecting the depth and quality of the talent pool. In addition, it includes the International Institute for Management Development (IMD) World Competitiveness Center’s World Talent Ranking 2025, which evaluates a country’s ability to develop, attract, and retain talent.
Key data sources include: Fortune 500, IMD World Competitiveness Center World Talent Ranking 2025, International Labour Organization
Top-Tier Employment Prospects
The top-tier employment prospects score assesses the likelihood of securing employment in globally recognized companies, leading international organizations, and innovative firms within the destination country. This measure is particularly relevant for individuals participating in residence and citizenship programs as it reflects access to competitive and internationally connected job markets.
The score incorporates the number of job postings by globally recognized companies and international organizations, alongside innovation indicators such as start-up activity, investment in research and development, and ICT development.
Business competitiveness is also considered through the IMD World Competitiveness Ranking 2025, which evaluates how effectively countries support sustainable economic performance and long-term growth.
The net migration rate sub-indicator reflects the balance between immigration and emigration relative to the population. Higher net migration indicates stronger talent inflows and a more dynamic labor market.
A European mobility sub-indicator is included to capture the advantage of access to the European Union labor market. Countries that provide access to free movement within the European Union or equivalent frameworks enable broader employment opportunities across multiple economies.
Key data sources include: IMD World Competitiveness Center World Competitiveness Ranking 2025, International Organization for Migration (IOM) Global Migration Data Portal, UN International Telecommunication Union ICT Development Index 2025
Premium Education
The premium education score is derived from The Henley Ultimate Portfolio and appraises countries based on the efficacy of their private education systems, taking into account their innovativeness, private education capacity (number of top universities and top-tier international schools, private primary and secondary school enrolments), and the quality of education and opportunities for studying they provide.
Key data sources: International Baccalaureate Organization, Quacquarelli Symonds Limited QS World University Rankings 2026, UN Development Programme Human Development Index, World Bank
Economic Mobility
The economic mobility score for each country is derived from the Henley Passport Power Index and represents the sum of the national GDP shares of global GDP for each of the destinations to which its passport holders have visa-free access, including their own GDP. The maximum possible score is 100, representing 100% of global GDP.
Key data sources: Henley Passport Index, IATA, World Bank
High Livability
The high livability score is derived from the Henley Ultimate Portfolio, which has been constructed with high- and ultra-high-net-worth investors in mind, and uses the scores for private healthcare, quality of life, and safety and security, equally weighted.
Private healthcare evaluates countries’ private healthcare systems by assessing domestic private health expenditure and the number of private hospitals and insurance companies in each, health security, and healthcare access and quality.
Quality of life assesses countries according to the happiness and well-being of their citizens, the quality of life they offer, the level of human development, the cost of living, and demographic pressures.
Safety and security measures each country’s peacefulness through assessing factors such as vulnerability to internal and external threats, overall political stability, and its progress towards achieving sustainability.
Key data sources: Private healthcare: Global Health Security Index, HAQ (The Healthcare Access and Quality Index), OECD, World Bank, World Health Organization. Quality of life: United Nations Development Programme Human Development Index, World Happiness Report, World Population Review. Safety and security: Fund for Peace Fragile States Index, Sustainable Development Report 2025, World Bank
Additional Factor: Number of Top 250 Universities
Unlike the other parameters, this factor is not converted into a score out of 100. Instead, it represents the number of universities in each country ranked among the Top 250 globally, as identified by the most recent QS World University Rankings. QS assesses over 1,500 institutions across 105 locations and its ranking is highly regarded by employers and academics, and is the only ranking to emphasize employability and sustainability — two important considerations for high-net-worth investors and their children when selecting world-class educational institutions.
The dataset for 32 countries, including the leading countries offering residence and citizenship programs and the top source markets for such programs, was collected between February and March 2026 from publicly available open databases for the most recent year available. The data derived from the Henley Ultimate Portfolio was updated in November and December 2025.
To ensure comparability across different types of indicators — namely, indicators with clear ranges, qualitative indicators, and indicators with wider or skewed distributions — three transformation approaches were applied, depending on the nature of the data:
Min-max normalization was applied to continuous indicators with clear ranges. For each indicator, the minimum value was transformed to 0 and the maximum value to 1, with all other values scaled proportionally:
x = (x – Min(x))/(Max(x) – Min(x))
Categorical scoring was used for qualitative indicators. Categories were defined based on relevant criteria, and each category was assigned a value between 0 and 1 according to its relative position.
Statistical standardization was applied to selected indicators with wider or skewed distributions. In these cases, values were standardized relative to the overall dataset and then rescaled to a 0–1 range. This approach helps reduce the impact of outliers and better reflect relative positioning across countries.
The choice of transformation method depends on the statistical properties of each indicator. Min-max normalization is applied where natural bounds exist, categorical scoring is used for qualitative variables, and statistical standardization is applied where distributions are skewed or contain outliers.
To maintain comparability with previous iterations of the index, the standardization process was calibrated against both the current dataset and the prior reference distribution. This ensures that year-on-year changes reflect real shifts in performance rather than purely statistical recalibration.
Aggregation Framework
Indicators were grouped into sub-parameters based on thematic relevance. Each sub-parameter includes between one and four indicators. Sub-parameter scores were calculated as the weighted sum of their underlying indicators:
Sub-parameter = ∑ (weighted individual indicators)
The six key parameters were then calculated as weighted sums of their respective sub-parameters and scaled to a 0–100 range:
Parameter = (∑ weighted sub-parameters) × 100
The total opportunity score is calculated by equally weighting the six parameters:
Total Opportunity Score = (1/6) × (Earning Potential + Career Advancement + Top-Tier Employment Prospects + Premium Education + Economic Mobility + High Livability)
The index is not intended to be a global ranking. It focuses on a defined set of countries, including leading destinations offering residence and citizenship programs, as well as key source markets for such programs.
Earning potential is based on modeled salary projections and should be interpreted as a comparative indicator. It does not fully reflect differences in taxation, cost of living, or individual circumstances.
Projections rely on current wage growth and inflation assumptions. Actual outcomes may differ due to changes in macroeconomic conditions.
Scores reflect relative performance within the selected group of countries. Changes in the composition of the country sample may influence results.
The analysis is based on aggregated data from multiple public and proprietary sources. Values are harmonized and adjusted to ensure comparability, and no single source is used in isolation.
Earning Potential
Earning potential reflects projected annual earnings in US dollars over a 10-year horizon, based on country-specific wage growth rates and adjusted for inflation. It is calculated using average salaries for high-skilled roles across the following sectors: agriculture, arts, business administration, finance, engineering, health, IT, law, and science. In the 2026 edition of the index, the role coverage has been expanded to include a wider range of specialized and high-demand occupations. This reduces sensitivity to outliers and improves cross-country comparability.
Nominal salary projections are calculated using country-specific wage growth rates.
To derive real growth, wage growth rates are adjusted for inflation. A minimum floor of 1% annual real growth is applied in cases where the difference between wage growth and inflation falls below this threshold. This assumption reflects a minimum level of long-term productivity growth and prevents short-term inflation spikes from producing declining long-term income projections.
Projected salaries are calculated using this adjusted real growth rate over the selected time horizon as follows:
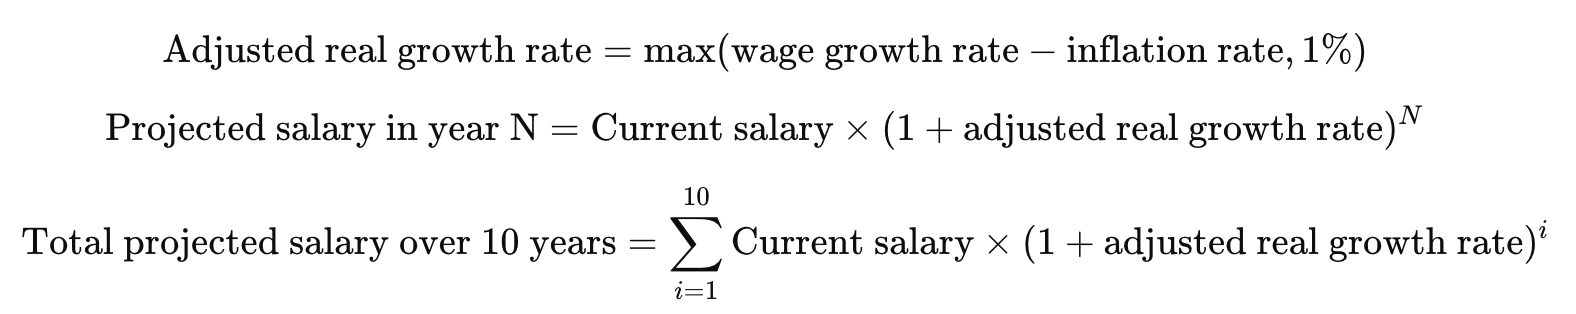
Wage growth rates reflect the most recent available data, while inflation is smoothed using multi-year averages to reduce volatility. As a result, short-term differences between wage growth and inflation may influence projected outcomes.
The calculations do not account for taxation or cost-of-living differences, which vary significantly across countries.
Sources: Country national statistics offices, European Commission, Glassdoor, International Labour Organization, International Monetary Fund, OECD, Paylab, Salary Expert
Career Advancement
Career advancement is calculated as the weighted sum of the following indicators:
Global 500 Companies: the number of companies headquartered in a country listed in Fortune’s 2025 Global 500. Source: Fortune
CEO demand: the number of job postings for executive positions, with values adjusted to the working population. Source: LinkedIn
Talent attraction and development: the country’s overall score on the International Institute for Management Development (IMD) World Competitiveness Center World Talent Ranking 2025. Source: World Talent Ranking
Labor force with advanced education: the percentage of the total working-age population with advanced education (namely short-cycle tertiary education or bachelor’s, master’s, or doctoral level or their equivalents). Sources: International Labour Organization, World Bank
Top-Tier Employment Prospects
Top-tier employment prospects is calculated as the sum of the following indicators, equally weighted:
Probability of finding employment in globally recognized companies and international organizations: the average of the two metrics below to avoid skewness and smooth the results, as both are approximate values:
The likelihood of finding employment in globally recognized companies and international organizations based on the number of such companies with offices in the country, represented as a percentage. Sources: Official company websites
The number of job postings by globally recognized companies and institutions seeking candidates in the country, adjusted per million working population. Sources: Official company websites, LinkedIn
Presence of start-ups: the number of start-ups founded in the past five years (2021–2026), adjusted to the working population. Source: Crunchbase
Digital development: the country’s universal connectivity pillar score in the UN International Telecommunication Union (ITU) ICT Development Index 2025, which measures the level of development of the information and communication technology sectors of 170 economies. Source: ITU
Net migration rate: the difference between the number of immigrants and emigrants per country, divided by the population. The higher the value, the higher the number of immigrants compared to emigrants and the population of the country. Source: International Organization for Migration (IOM) Global Migration Data Portal
Country competitiveness: the country’s overall score on the International Institute for Management Development (IMD) World Competitiveness Ranking 2025. Source: World Competitiveness Ranking
European Union mobility: countries that are members of the European Union or participate in the EU free movement framework (including equivalent bilateral agreements) score 1; others score 0. Source: European Union
Premium Education
Premium education is derived from the Henley Ultimate Portfolio score for premium education. View the methodology and sources here.
Economic Mobility
Economic mobility is derived from the Henley Passport Power Index (HPP) score for economic mobility. The HPP score assesses the 199 countries included on the Henley Passport Index according to the percentage share of global GDP to which their passport holders have visa-free access, by taking into account their visa-free/visa-on-arrival scores out of a possible 227. View the methodology and sources here.
High Livability
The high livability score is calculated as the sum of the Henley Ultimate Portfolio scores for private healthcare, quality of life, and safety and security, equally weighted. View the methodology and sources here.
Number of Top 250 Universities
The number of universities ranked in the Top 250 globally. Source. Quacquarelli Symonds Limited QS World University Rankings 2026
As the global leader in residence and citizenship planning, Henley & Partners is best placed to advise you and your family. Contact us for a free consultation.