Callback





Philipp A. Baumann is the founder at Z22 Technologies, a FINMA-authorized manager running a Bitcoin-denominated strategy.
On 1 July, Bitcoin printed the current cycle low, around USD 57,700 — 54% below the record of a little over 126,000 set last October. The familiar verdicts followed. The more useful read is the long one: volatility is very much still there, each completed cycle drawdown has come in smaller than the one before, and the recovery this time took weeks instead of the multi-year grind of the early cycles.
The question that matters is the boring one — how much of this volatility a given position can absorb, over what time, with whose money. The past two months show what that looks like in practice: by August 24, Bitcoin had already recovered to around USD 77,700, roughly a 35% move off the low it marked just under two months earlier.
The cycle peaks make the direction obvious. Annualized realized volatility stood at 176% in 2011, 137% in 2013, 92% in 2017, 77% in 2021. The trailing year, through 24 August 2026, prints 44% — under half of the 2017 reading, a quarter of 2011.
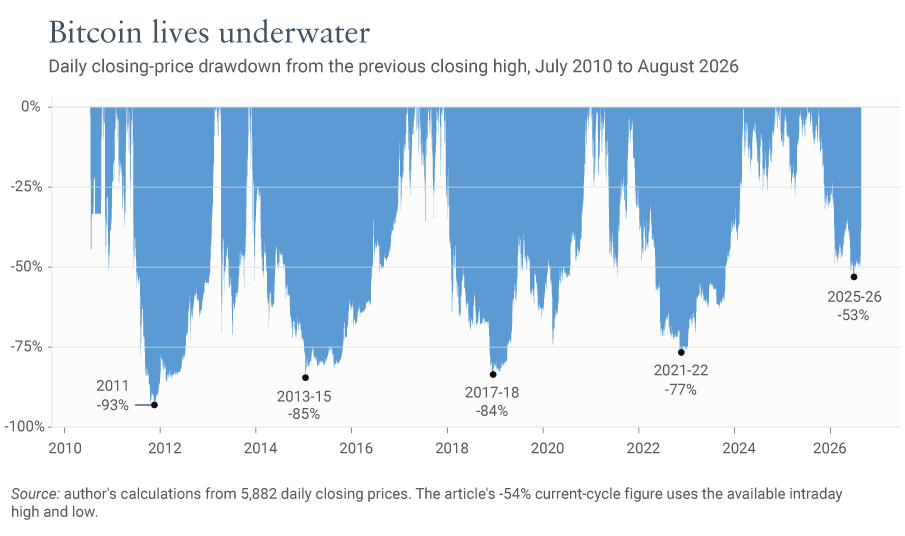
Drawdowns at the end of each cycle went the same way: -93% in 2011, -85% in 2013–15, -84% in 2017–18, -77% in 2021–22. For the current cycle, data shows a maximum drawdown of -54%. The whole series points one direction.
Figure 1. Underwater Chart: Bitcoin has spent most of its history below its previous closing high
Source: Author’s calculations using CoinDesk, Blockchain.com, and Yahoo Finance data.
Taken together, the two series describe a market that got bigger and calmer in one motion; it is still violent on any given day, just noticeably less violent than in the early years.

Across the 5,882 daily closes since July 2010, Bitcoin finished at least 20% below its previous closing high on 76.7% of them. At least 50% below on 46.5% of all days. A strictly new closing high came on only 4.2%.
Underwater is the baseline state. Anyone who reads every decline as fresh information ends up reacting to Bitcoin’s normal condition most of the cycle, and that is the most expensive habit this asset offers.
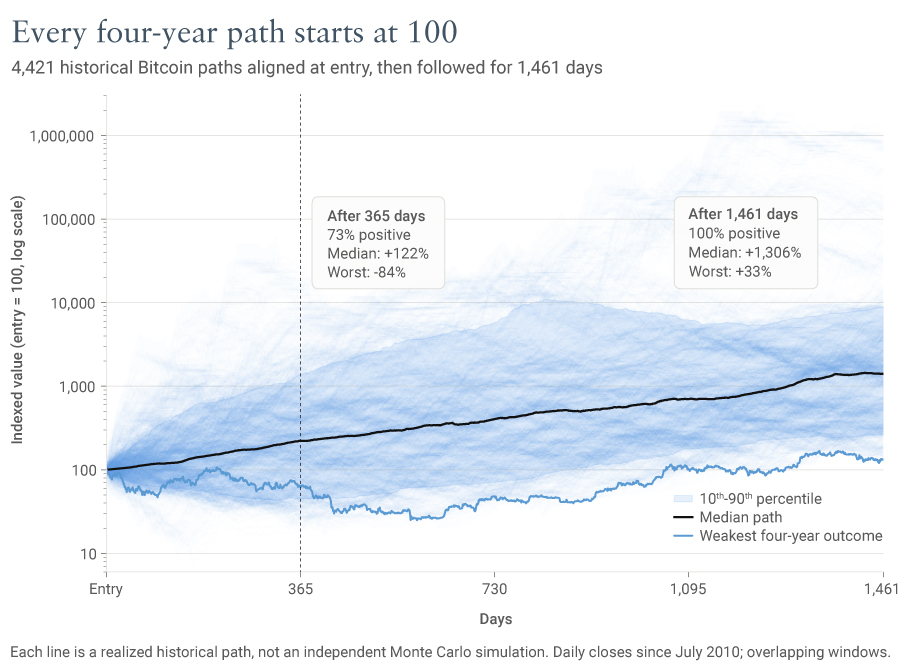
Of the rolling one-year windows since 2010, 73% ended with a gain, and the worst of them lost 84%. The four-year windows are where the curve bends — all 4,421 of the rolling four-year periods ended positive, the weakest at +33%.
Figure 2. Holding Periods: 73% of 365-day periods and 100% of 1,461-day periods ended positive
Source: Author’s calculations using CoinDesk, Blockchain.com, and Yahoo Finance data.
None of that promises anything about the next four years, and the 27% who lost on a one-year hold lost real money. Duration is simply the variable an investor controls: capital that may be needed within a year stays inside the losing 27% of the observed one-year outcomes.
BlackRock published recent research on this, and the numbers are blunt. In a standard 60/40 portfolio, 1% of Bitcoin carries roughly 2% of the portfolio’s total risk. At a 2% allocation it carries 5% of the total risk, and at 4% it carries 14%. Not many allocators have that curve in their head when they set a size.
Leverage turns a temporary loss into a permanent one. On 10 October 2025, more than USD 19 billion of crypto positions were liquidated in roughly a day. Forced sellers cannot wait for the price to return, and volatility moves money from those who had to act to those who did not have to.
The Crypto Wealth Report 2026 counts 135,694 crypto millionaires, 290 centi-millionaires, and 23 billionaires as of 31 August 2026. The figures are a snapshot of arrival, and they say very little about the route by which people got there.
At the July low, a holder who had bought near USD 3,000 watched a correction inside a 1,800% gain. Someone entering near 126,000 watched the same price cut 54% into their capital. Same tape that day; the two positions simply lived it very differently.
Professionals carry a different constraint set to begin with — risk limits, mandates, clients, committees that must answer to someone. A private holder may not have to act at all, and that option is one of the most valuable things in the relationship to the asset.
Crypto coverage tracks price, more or less mechanically: confident near the top, cynical near the bottom, and the loudest claims at precisely the moments when the data underneath deserves the most attention. A better routine starts with primary market data, fund-flow reports, filings — and the strongest argument from the other side, even when it is annoying to read.
The position should simply be small enough that a red number still permits cold analysis. The investors who compound across cycles have rarely called every turn. They sized the risk so that a crash could not force a sale, and they still had liquidity left when everyone else ran out of it.



As the global leader in residence and citizenship planning, Henley & Partners is best placed to advise you and your family. Contact us for a free consultation.